“Another flaw in the human character is that everybody wants to build and nobody wants to do maintenance.”
Kurt Vonnegut, Hocus Pocus
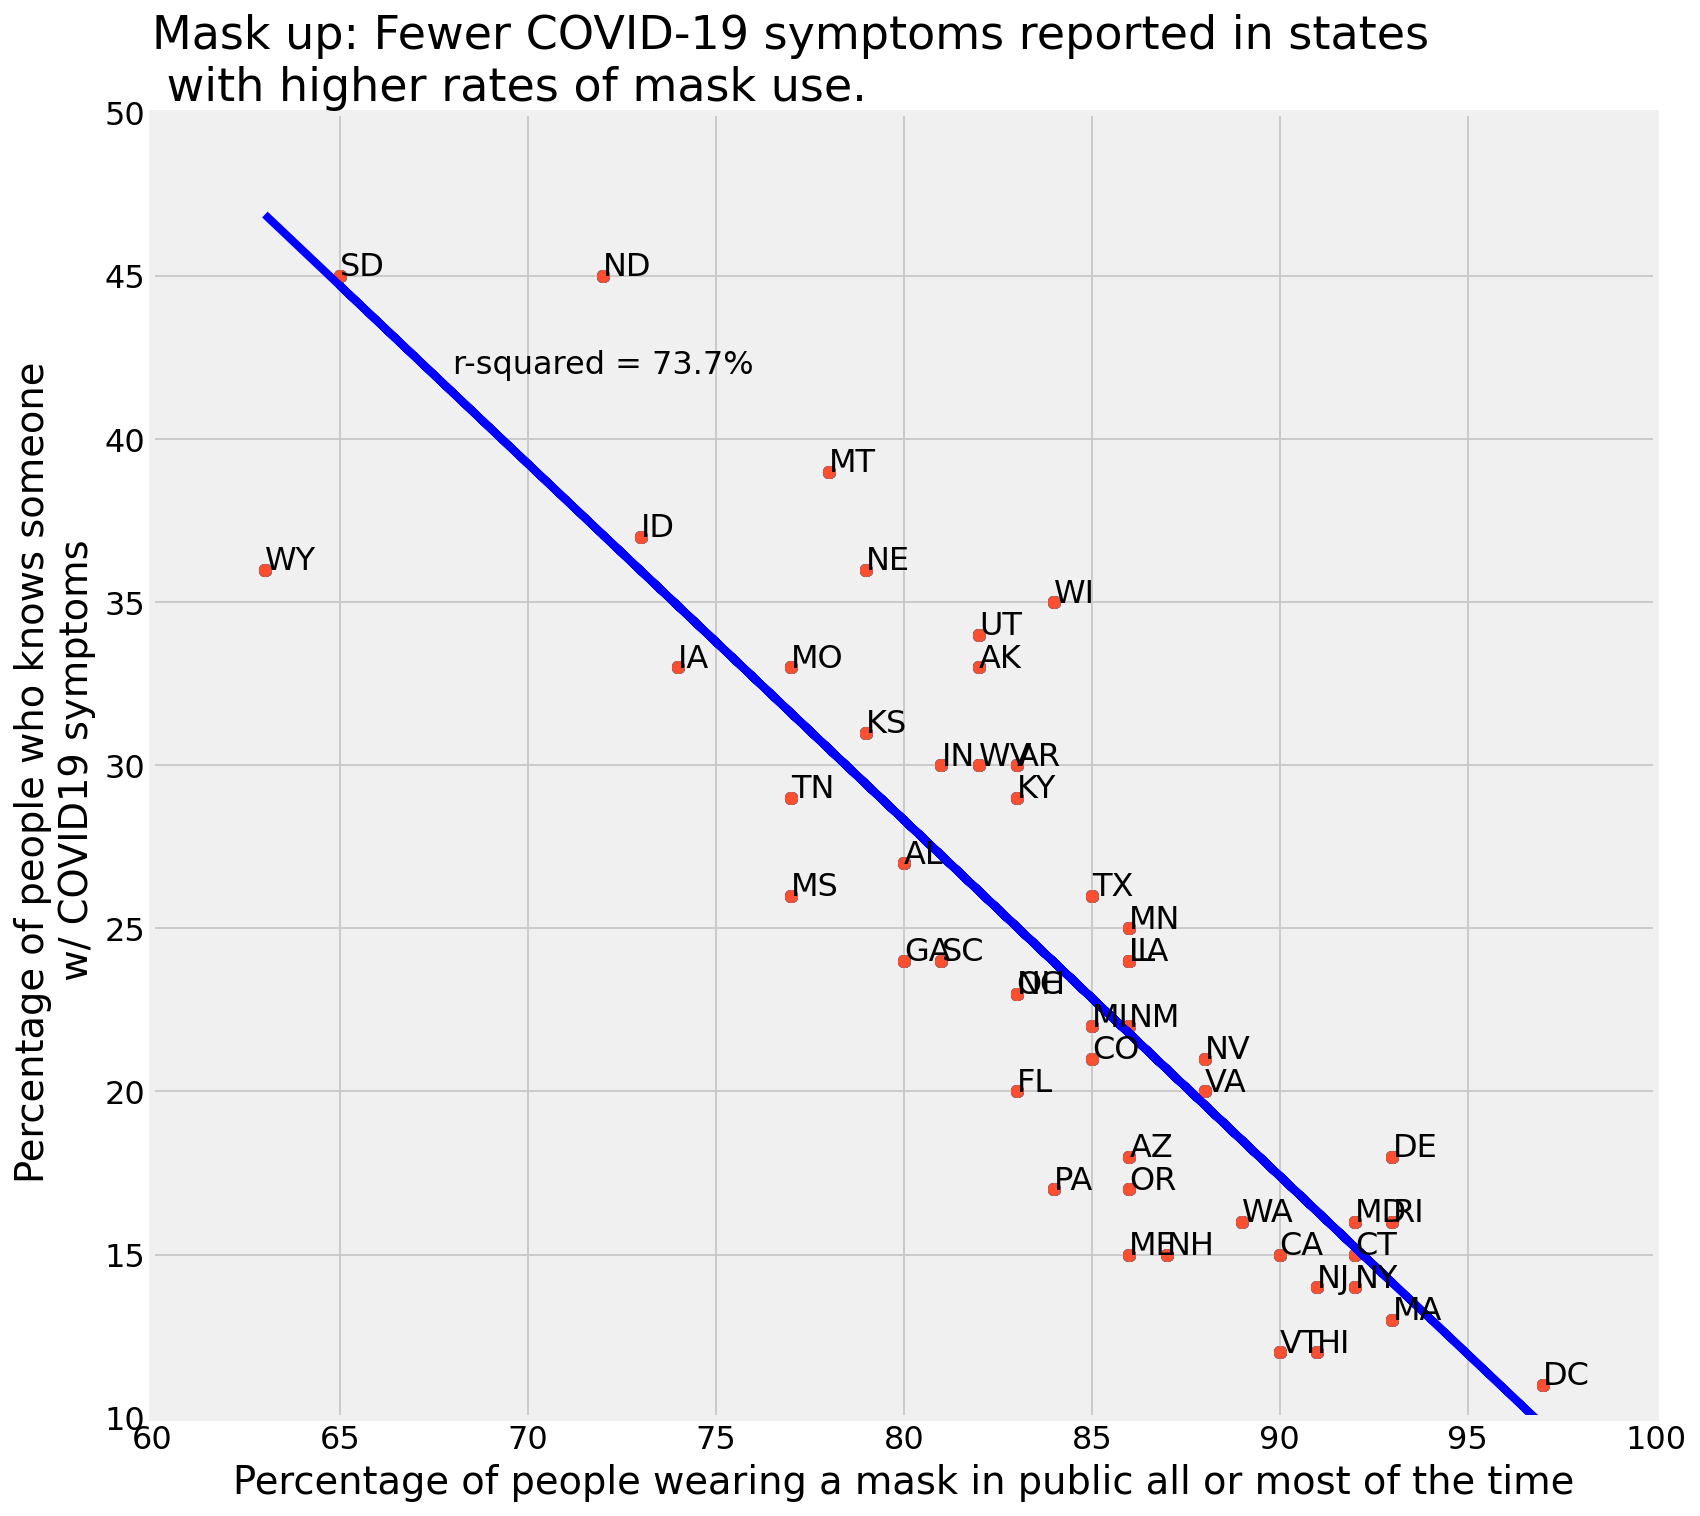
Viewed through the lens of total cost of facility ownership, the initial 20 to 30% of life-time costs for a constructed asset (building, road, bridge, etc.) occur in the first 2 to 4 years of existence accounting for planning, design, construction, and start-up. What about the remaining 70 to 80% of costs? The remaining 80% represents the majority of the cost an owner will incur – for operating, maintaining, recapitalizing, and disposing. Despite that, every client I have ever worked with faces significant funding shortfalls for maintenance and recapitalization. We celebrate ribbon cuttings; no one celebrates ongoing maintenance.
As consultants, we all probably follow a rigorous quality management plan and quality assurance / quality control processes but we are all human. Mistakes happen. A colleague recently asked if I worried about making mistakes in deliverables. I said I did not because in our line of consulting, no one will die from one of those mistakes. That was not always the case when I was a consultant specializing in bridge design & inspection.
This scenario used to give me nightmares – a bridge I had inspected collapsing sometime after the inspection. I cannot tell you how many bridges my teams inspected over the years with significant section loss in structural members. We closed major interstates and lanes of major bridges. As of 2021, the American Society of Civil Engineers (aka ASCE) gave America’s infrastructure an overall score of C- and bridges a C.
NTSB shares probable cause of Fern Hollow Bridge collapse
This week, an engineering friend pointed me to the NTSB’s findings on the collapse of the Fern Hollow Bridge in Pittsburgh:
“The collapse began when the transverse tie plate on the southwest bridge leg failed due to extensive corrosion and section loss. The corrosion and section loss resulted from clogged drains that caused water to run down bridge legs and accumulate along with debris at the bottom of the legs, which prevented the development of a protective rust layer or patina. Although repeated maintenance and repair recommendations were documented in many inspection reports, the City of Pittsburgh (City) failed to act on them, leading to the deterioration of the fracture-critical transverse tie plate and the structural failure of the bridge.”
…
Although maintenance and repair recommendations were repeatedly made in the bridge inspection reports, the City failed to act on several of these recommendations, which led to progressive deterioration and the collapse of the bridge.
There’s a YouTube animation of the collapse by the NTSB:
https://youtu.be/J-VnWB4fiFk&t=195
The collapse animation begins at 3:15 of the video. The first 3-minutes provide a detailed overview of the bridge and the situation. In this disaster, the inspectors were not to blame – they had identified the problem in reports over and over for years.
NTSB recommendations: There are almost too many recommendations to include in one summary, but here are the big ones (in the opinion of the author of the original article):
-
To FHWA: Require a one-time review of the existing fracture-critical member (nonredundant steel tension member) inspection plans for bridges with nonredundant steel frame leg designs in its inventory.
-
To PennDOT: Develop and implement a plan to publish yearly aggregate data on bridge maintenance and repair recommendations.
-
To AASHTO: Update the Manual for Bridge Evaluation to include guidance that addresses the identification of localized tension zones and tension components in nonredundant steel members that are generally considered to be fully or partially in compression.
Lack of maintenance funding is a serious problem
The city of Pittsburgh, in the aftermath of the Fern Hollow Bridge collapse, stood up a Bridge Asset Management Program. Similar to any agency managing a large portfolio of constructed assets, the city is extremely underfunded for maintenance & repair. The Bridge Asset Management Program Overview indicates annual routine maintenance reeds of $9.75M across activities like cleaning & washing, deck joint repair/replacement, painting, crack sealing & patching, and deck overlays across an inventory of 99 vehicular and 47 pedestrian bridges.
Table 1: 2021 - 2024 Annual Maintenance funding, Pittsburgh Bridge Program
| year |
funding |
| 2021 |
$0.39M |
| 2022 |
$0.75M |
| 2023 |
$0.95M |
| 2024 |
$1.05M |
The city faces an annual routine maintenance shortfall of $8.7M, or 8.3 times current available funding. Another report by the consultant, WSP, showed that city bridges will need nearly $500 million in improvements over the next 32 years, or about $15.6M per year.
My favorite part from the full article in the Pittsburgh Union Press (published by the striking workers at the Pittsburgh Post-Gazette, but that’s another story in itself) is the ending where the board chair, Jennifer Homendy, leveraged the quote that started this post by pointing out the paradox that problems cited in decades worth of inspection reports were ignored but the city built a new bridge replacement in less than a year:
She referred to a line in famed author Kurt Vonnegut’s 1990 novel, “Hocus Pocus,” that read: “Another flaw in the human character is that everybody wants to build and nobody wants to do maintenance.”
We need to figure out how to fund long-term maintenance needs for the nation’s infrastructure. Until we do, tragedies like the Fern Hollow Bridge collapse, and worse, will continue. Recent legislation like the Bipartisan Infrastructure Law (BIL) and the Great American Outdoors Act (GAOA) are band-aids on the wound unless long-term funding to close the ongoing maintenance gap is identified.
Full article
NTSB cites Pittsburgh, state, federal failures in Fern Hollow Bridge collapse, Pittsburgh Union Press:
https://www.unionprogress.com/2024/02/21/ntsb-cites-pittsburgh-state-federal-failures-in-fern-hollow-collapse/
Reference
- Whole Bulding Design Guide - Operation & Maintenance Planning: As Figure 1 illustrates, 80% of a facility’s life-cycle costs are associated with Operation & Maintenance (O&M).
]]>