Producing Small Multiples of COVID-19 case rates by state
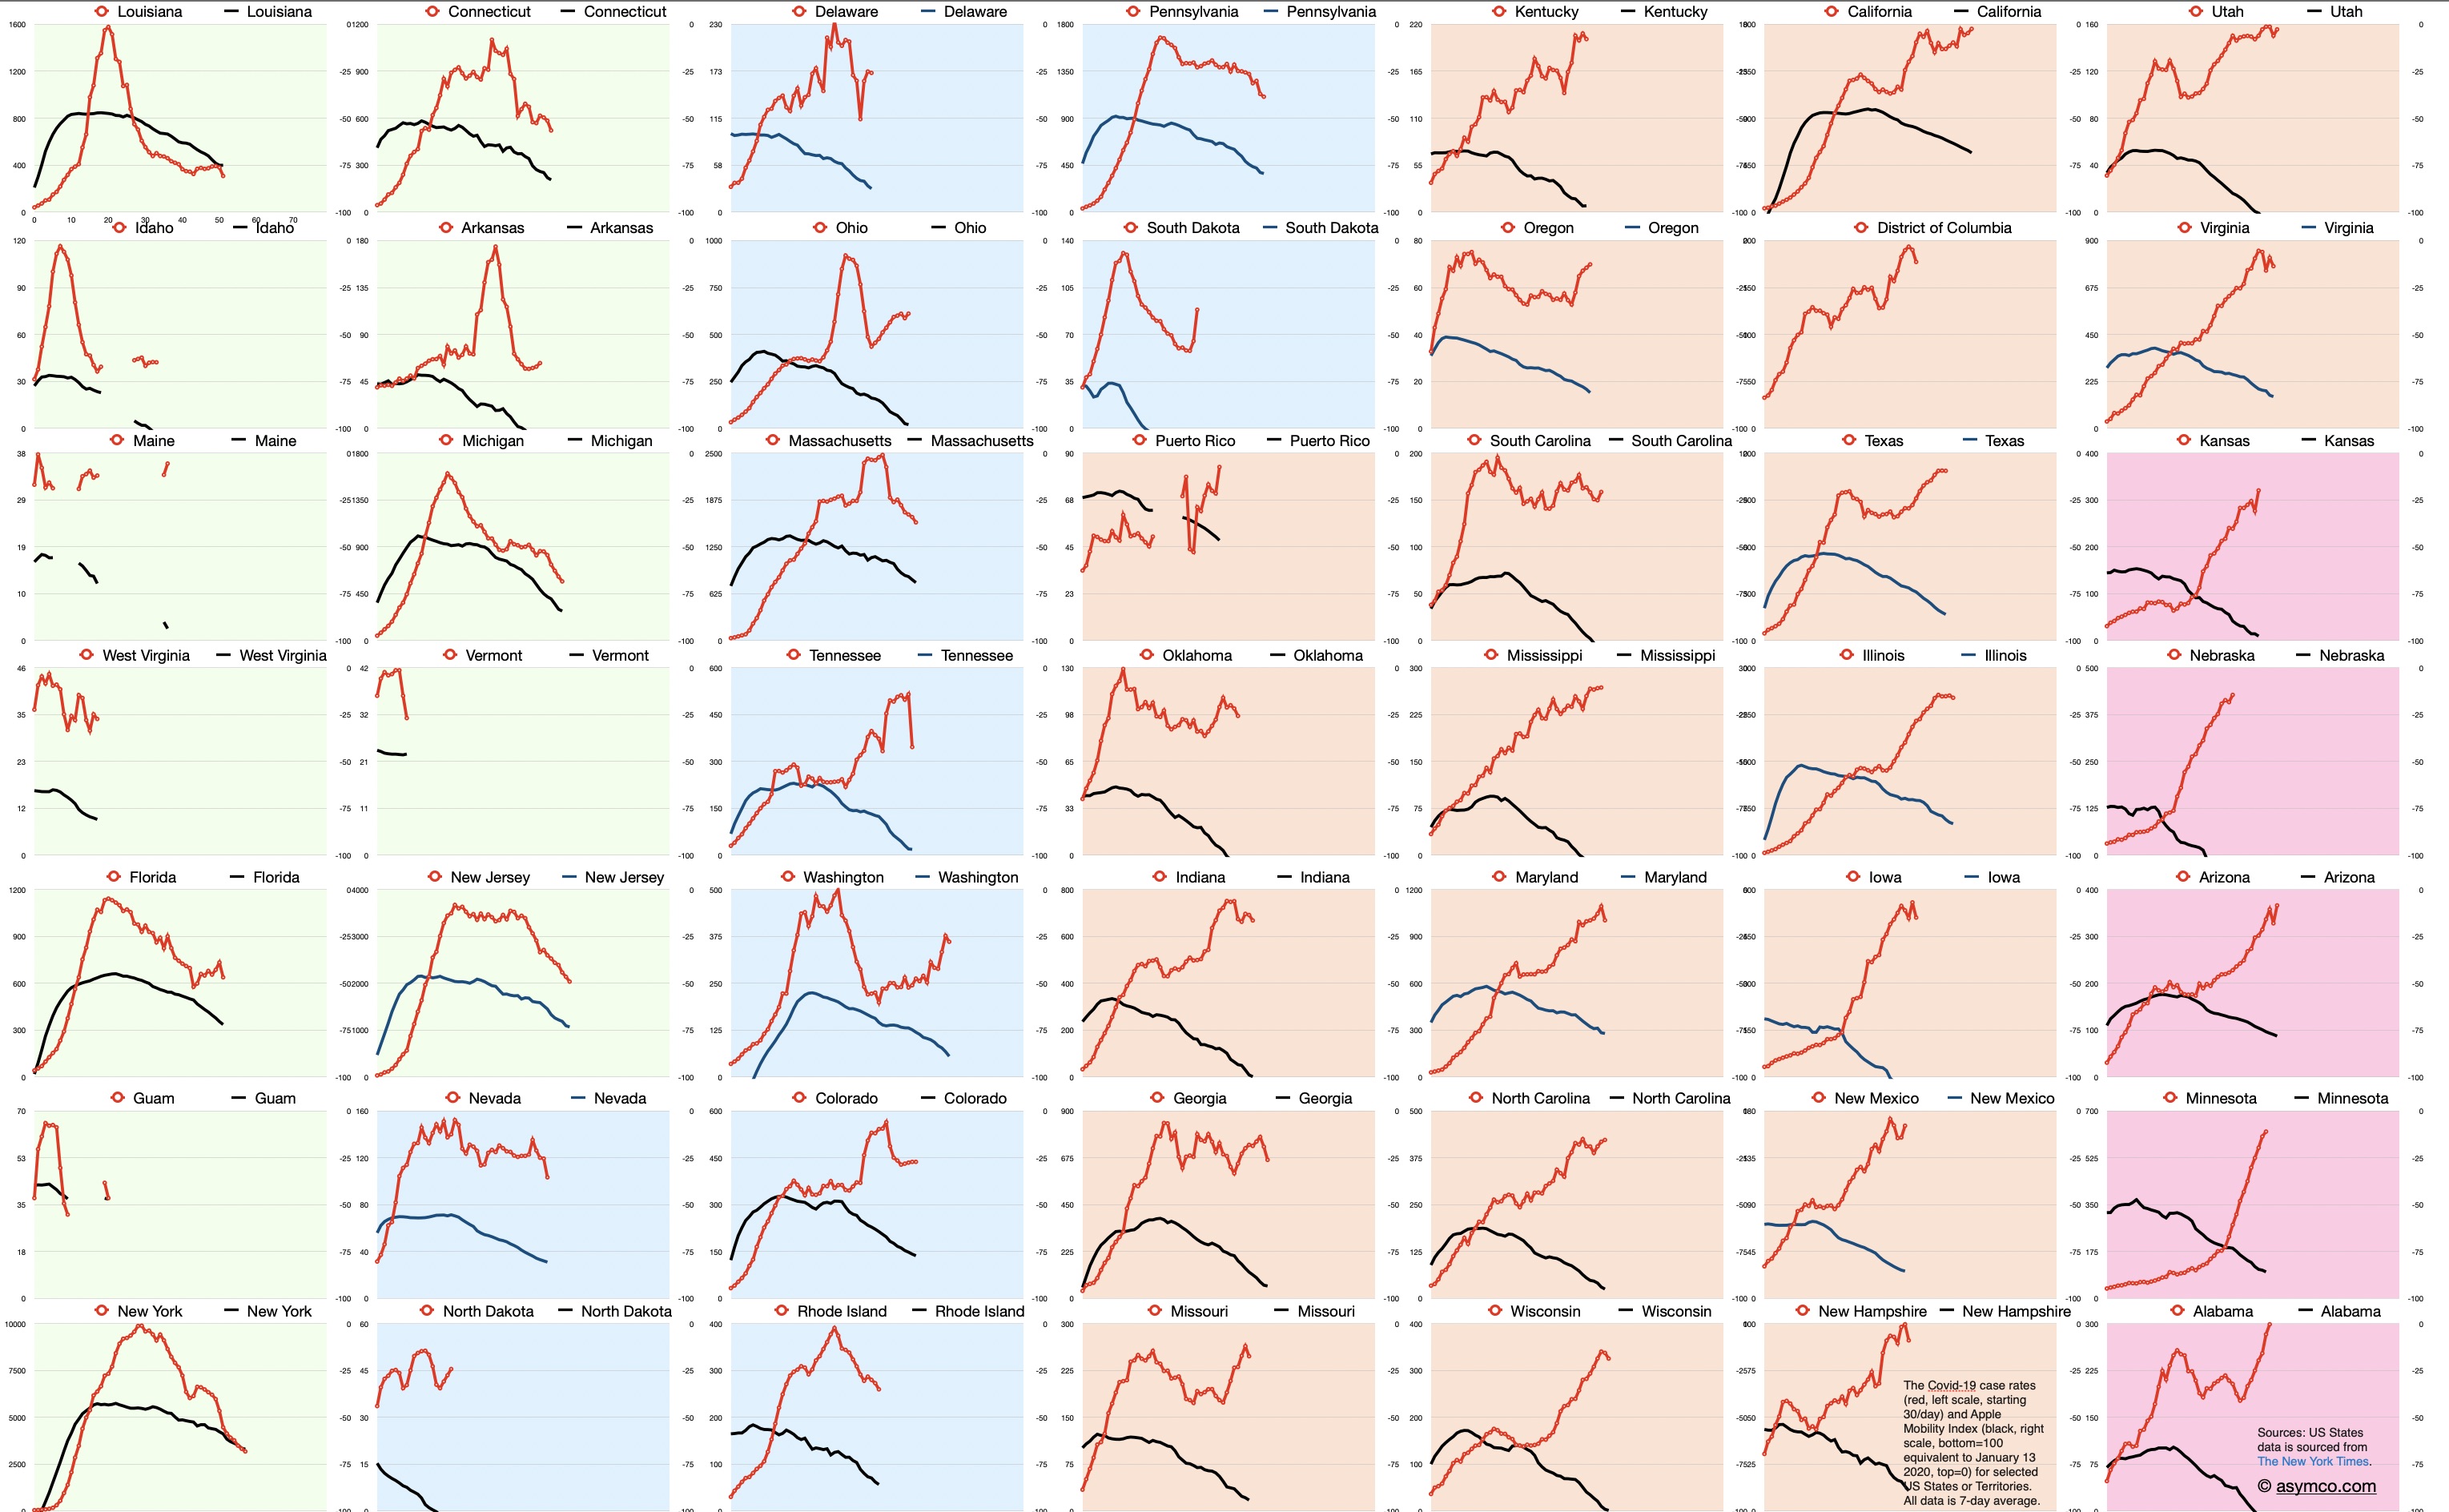
Inspired by my love for small multiples, Horace Dediu’s recent work on Asymco, and the pandemic the world is experiencing I decided to put my Python skills to test and produce a small multiples plot of case rates for the United States.
I’m pleased with the result but already see things I would like to incorprate for v2.0.
If you’d like to use the script yourself I have made it available online. The plots are all COVID-19 case rates starting once a state reaches 30 cases/day. All data is 7-day average and the source is the NY Times COVID data from GitHub.
What trends do you see?
