Collatz Conjecture Redux
Remember the Collatz Conjecture which posits that any positive integer, n, will eventually reduce to one if you divide the integer by 2 (n/2) if the integer is even and multiply by 3 and add 1 (3n+1) if the integer is odd? The result is repeated until eventually you land on 1. Turns out that in addition to being an interesting exercise for an Excel workbook and some simple VBA code the Collatz Conjecture lends itself to being a python programming exercise.
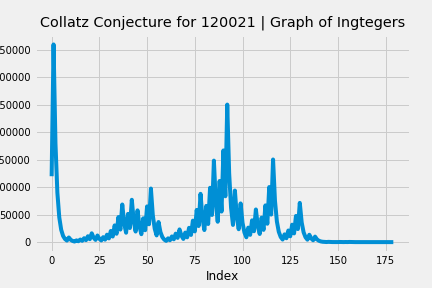
I put together a Jupyter notebook with some code that will run any user entered integer, store the result in a data frame, and plot the output on a graph.
Enjoy.
# collatz.py
# define a function that is the collatz conjecture - any positive integer will eventually reach 1
# n is even: n/2
# n is odd: 3n + 1
# HOTPO - half or triple plus one indefinitely
def collatz(number):
    if number % 2 == 0:
        return number // 2

    elif number % 2 == 1:
        result = 3 * number + 1
        return result

import pandas as pd

# setup for plotting
from matplotlib import pyplot as plt
import seaborn as sns
plt.style.use('fivethirtyeight')
%matplotlib inline

collatz_list = []
pd.set_option('display.float_format', '{:,}'.format)

# prompt user
try:
    n = input("Enter number: ")
    seed = n
    while n != 1:
        collatz_list.append(int(n))
        n = collatz(int(n))
    print('your list of collatz integers is: ');
    print(collatz_list);
    print();
    print('steps to reach 1: ');
    print(len(collatz_list));
    print();
    print('max number: ')
    collatz_list_max = max(collatz_list)
    print(f"{collatz_list_max:,}");
    df_collatz = pd.DataFrame(collatz_list)

    # Formatting for commas on the Y-axis
    ax = df_collatz.plot(kind='line')
    ax.yaxis.set_major_formatter('{x:,.0f}')  # Commas, no decimals for integers

    #plt.title('Collatz Conjecture for ' + str(seed) + ' | Graph of Ingtegers', y=1.01)
    #plt.title(f"Collatz Conjecture for {seed:,} Graph of Integers", y=1.01)
    # Alternative formatting with int() and format() methods
    seed_int = int(seed)  # Convert seed string to integer
    seed_formatted = "{:,}".format(seed_int)  # Format integer with comma separators
    plt.title('Collatz Conjecture for ' + seed_formatted + ' | Graph of Integers', y=1.01)

    plt.xlabel('Index')
    plt.ylabel('Integer')

except ValueError:
    print('whoops, type an integer next time, neo.')