Coursework: Making Data Management Decisions
I enrolled in a Coursera course titled ‘Data Science + Analytics’. The third week, Making Data Management Decisions requires a blog post describing the data management decisions made for your project, so this is my post. See below for the program and output.
For this project I am interested in exploring feelings about the criminal justice system and whether a belief that blacks and other minorities are treated the same as whites (or not) is associated with education, religious beliefs, or socio-economic status.
Data management decisions
One obvious data management decision for this week’s assignment was to focus on education level and use subsets to isolate the data for those with some college education and higher from those with high school or lower education levels.
Another decision regarding data management was to use a significant amount of formatting to have the tables clearly labeled and have categories assigned that are understandable to humans and not just numbers, i.e., 18-29 for an age category instead of the number 1 in the Age tables.
Education level plays a role in the belief that blacks and minorites do not receive equal treatment in the legal system.
According to the data the higher an individual’s education level the more likely they are to believe blacks and minorities are not treated equally in the legal system.
Among the 1,375 responses with some college or higher education 54.68% (736) believe blacks and minorities do not receive equal treatment (categories 6 & 7 on a 7-pt scale). There were 29 missing responses.
However, among the 919 responses with a high school or lower education 42.67% (381) believe blacks and minorities do not receive equal treatment (categories 6 & 7). There were 26 missing responses.
Higher levels of education also lead to higher levels of trust in the legal system.
The data indicates that increased levels of education lead to higher levels of trust in the legal system.
Among the 1,375 responses with some college or higher education 39.48% (531) trust the legal system just about always or most of the time (categories 1 & 2). There were 30 missing responses.
For the 919 responses with a high school or lower education 31.75% (281) trust the legal system just about always or most of the time (categories 1 & 2). There were 34 missing responses.
Other frequency distributions
There are frequency distribution tables shown in the results for Age distribution as well as whether individuals agreed or disagreed that places of worship should be involved in politics. The age distributions were fairly similar for both groups with the group having high school level or less educations skewing slightly younger - 21.9% in the 18-29 range verse 14.3% for the college educated or higher. There were no missing age responses in either group.
Individuals with lower levels of education were more likely to agree that places of worship should be involved in politics
According to the frequency distribution tables for this question those with lower levels of education are more likely to think places of worship should be involved in politics. Among the 919 responses with high school educations or less, 9.2% strongly agreed that places of worship should be involved in politics (there were 57 missing responses). For the 1,375 individuals with some college or higher levels of education, 8% strongly agreed that places of worship should be involved in politics (there were 42 missing responses).
Full Results and Sample Output
As we are required to post the output of the programs used I have provided PDFs by education level:
A screenshot of three of the tables for the some college and higher levels of education group is shown below.
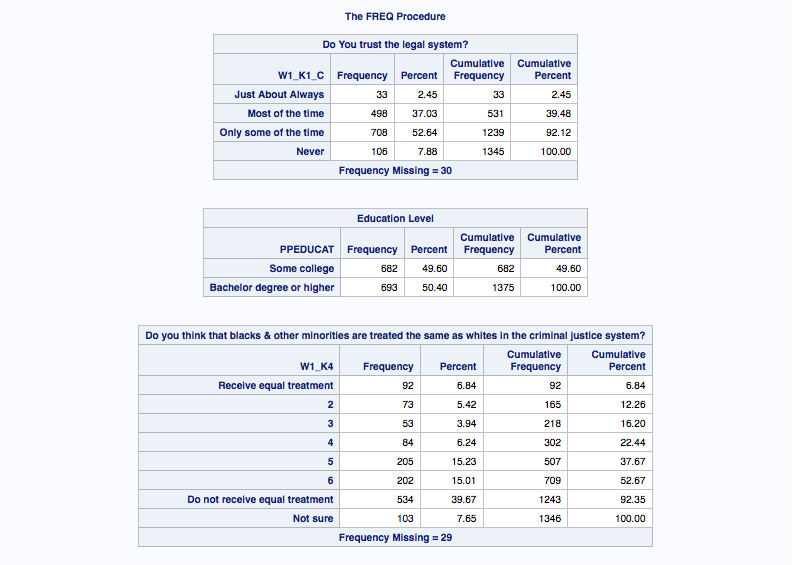
SAS Program Output for the Frequency Procedure, Source: S. Prestridge
Program for some college or higher levels of education
Since the two programs are very similar (only one line difference) I am including just the one for the some college education or higher group.
LIBNAME mydata "/courses/d1406ae5ba27fe300 " access=readonly;
DATA new; set mydata.oll_pds;

LABEL   W1_K4="Do you think that blacks & other minorities are treated the same as whites in the criminal justice system?"
        PPEDUCAT="Education Level"
        W1_M1="Religion? | 1=Baptist | 2=Protestant | 3=Catholic | 4=Mormon | 5=Jewish | 6=Muslim | 13=None"
        W1_M3="Places of worship should be involved in politics. Agree or disagree?"
        W1_K1_C="Do You trust the legal system?"
        PPAGECT4="Age";

/*set missing data*/
IF W1_K4=-1 THEN W1_K4=.;
IF W1_M1=-1 THEN W1_M1=.;
IF W1_M3=-1 THEN W1_M3=.;
IF W1_K1_C=-1 THEN W1_K1_C=.;

/* subset to include some college or more education */
IF PPEDUCAT GE 3;

PROC SORT; by CASEID;

/* add formatting for W1_K1_C - Trust Legal System */
PROC FORMAT;
    value W1_K1_C_groups
    1='Just About Always'
    2='Most of the time'
    3='Only some of the time'
    4-high='Never';
Run;

/* formatting for W1_M1 Religion */
PROC FORMAT;
    value W1_M1_groups
    1='Baptist'
    2='Protestant'
    3='Catholic'
    4='Mormon'
    5='Jewish'
    6='Muslim'
    7='Hindu'
    8='Budhist'
    9='Pentacostal'
    10='Eastern Orthodox'
    11-12='Other Christian'
    13='None';
Run;

/* formatting for PPEDUCAT - Education Level */
PROC FORMAT;
    value PPEDUCAT_groups
    1='Less than high school'
    2='High School'
    3='Some college'
    4-high='Bachelor degree or higher';
Run;

/* formatting for W1_K4 - Treated Same as Whites table */
PROC FORMAT;
    value W1_K4_groups
    low-1='Receive equal treatment'
    7='Do not receive equal treatment'
    9-high='Not sure';
Run;

/* formatting for W1_M3 - Places of worship involved in politics*/
PROC FORMAT;
    value W1_M3_groups
    1='Strongly Agree'
    2='Somewhat Agree'
    3="Somewhat Disagree"
    4='Strongly Disagree';
Run;

/* formatting for PPAGECT4 - Age */
PROC FORMAT;
    value PPAGECT4_groups
    1='18-29'
    2='30-44'
    3='45-59'
    4='60+';
Run;

PROC PRINT; VAR W1_K1_C PPEDUCAT W1_K4 W1_M1 W1_M3 PPAGECT4;

PROC FREQ; TABLES W1_K1_C PPEDUCAT W1_K4 W1_M1 W1_M3 PPAGECT4;
    Format W1_K1_C W1_K1_C_groups.;
    Format PPEDUCAT PPEDUCAT_groups.;
    Format W1_K4 W1_K4_groups.;
    Format W1_M1 W1_M1_groups.;
    Format W1_M3 W1_M3_groups.;
    Format PPAGECT4 PPAGECT4_groups.;
RUN;