Coursework: Visualizing Data
The univariate graph of trust in the legal system is shown below. The graph is unimodal with the peak at the median category of 3 (‘Only some of the time’). It seems to be skewed left as there are higher frequencies in the higher than the lower categories.
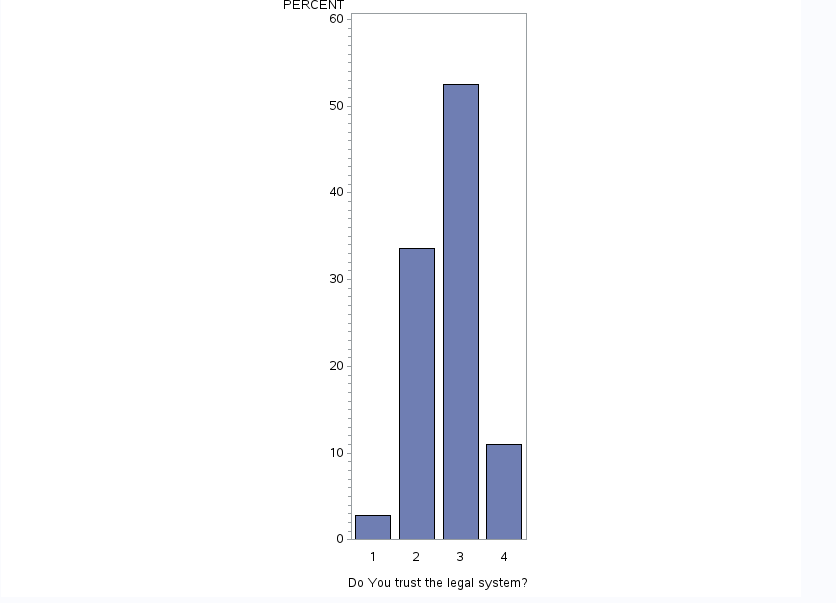
Univariate graph - Trust in Legal System, Source: S. Prestridge
The univariate graph of whether people believe that blacks and minorities are treated the same as whites in the criminal justice system is shown below. The graph is unimodal with the highest peak at category 7 corresponding to ‘Do not receive equal treatment’. The graph is skewed left since there are higher frequencies in the higher than the lower categories indicating most respondants do not believe blacks and minorities are treated the same as whites in the criminal justice system.
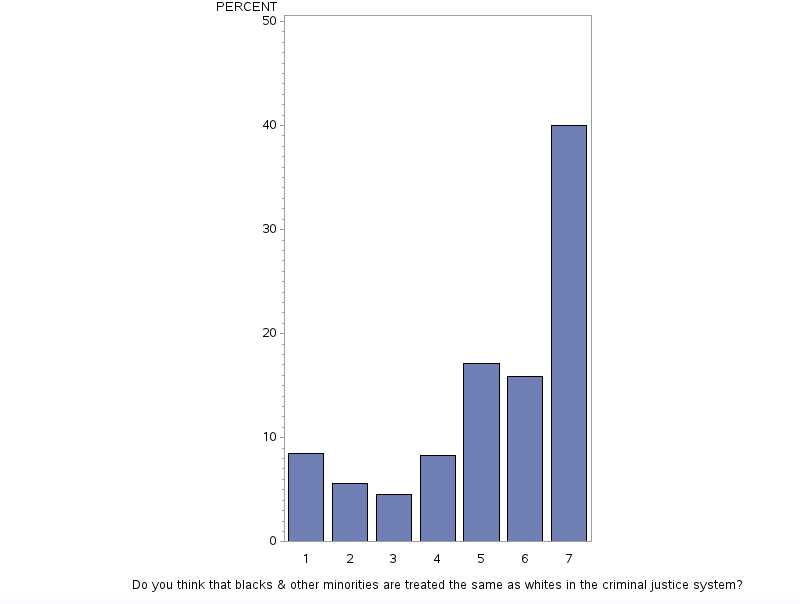
Univariate graph - Equal Treatment in the Legal System, Source: S. Prestridge
Generally the variables focused on here are qualitative not quantitative so my program does not produce a scatter plot (bivariate graph). I did compare age and education level to the belief that blacks and minorities do not receive equal treatment in the justice system. The graphs below show age group and education level. For group 1 of education level all individuals with a high school education or less are included while group 2 is some college or higher levels of education. The age graph indicates there is not a real difference in belief due to age while the education graph indicates a slight preference that the more highly educated an individual the more likely they are to believe blacks and minorities do not receive equal treatment in the legal system.
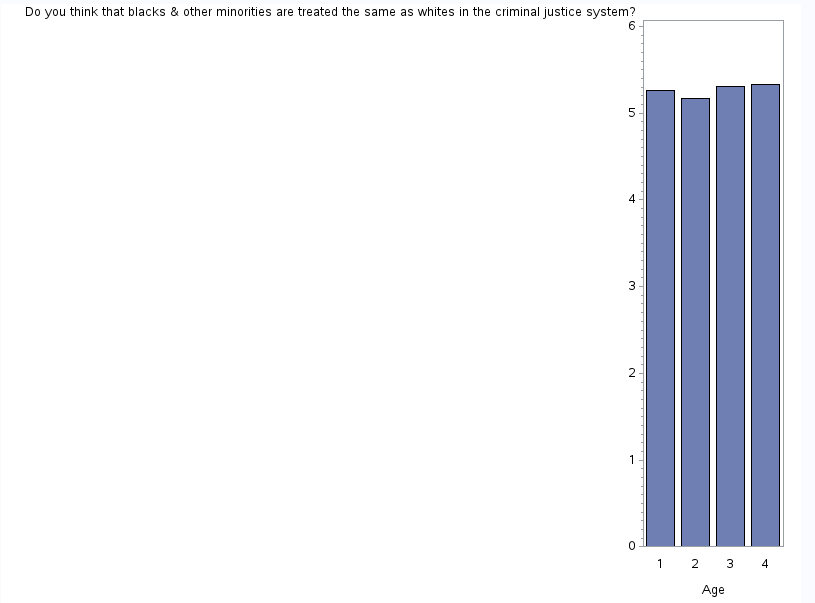
Graph - Equal Treatment in the Legal System and Age, Source: S. Prestridge
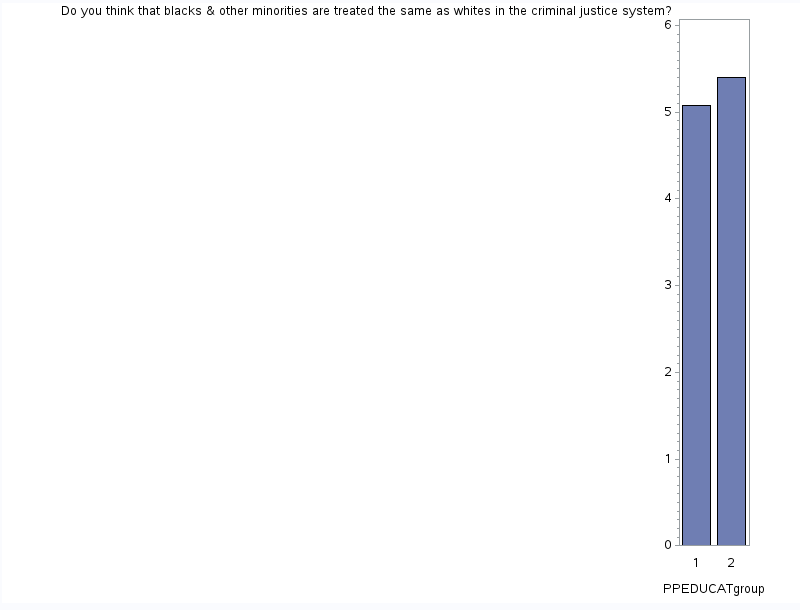
Graph - Equal Treatment in the Legal System and Education, Source: S. Prestridge
SAS Program
LIBNAME mydata "/courses/d1406ae5ba27fe300 " access=readonly;
DATA new; set mydata.oll_pds;

LABEL   W1_K4="Do you think that blacks & other minorities are treated the same as whites in the criminal justice system?"
        W1_K1_C="Do You trust the legal system?"
        PPEDUCAT="Education Level"
        PPAGECT4="Age";

/*set missing data*/
IF W1_K4=-1 THEN W1_K4=.; /* treated equal */
IF W1_K4=9 THEN W1_K4=.; /* if they don't know, also blank */
IF W1_K1_C=-1 THEN W1_K1_C=.;

/* subset to include high school education or less
IF PPEDUCAT LE 2; */

/* subset the data to include no trust in legal system 3-sometimes & 4-never
IF W1_K1_C GE 3; */

/* subset to include trust in legal system 1-always & 2-most times
IF W1_K1_C LE 2; */

IF PPEDUCAT LE 2 THEN PPEDUCATgroup=1;
ELSE IF PPEDUCAT GE 3 THEN PPEDUCATgroup=2;

PROC SORT; by CASEID;

/* add formatting for W1_K1_C - Trust Legal System */
PROC FORMAT;
    value W1_K1_C_groups
    1-2='Trust'
    3-high='Mistrust';

/* formatting for PPEDUCAT - Education Level */
PROC FORMAT;
    value PPEDUCAT_groups
    1-2='High School or lower'
    3-high='Some college or higher';

/* formatting for W1_K4 - Treated Same as Whites table */
PROC FORMAT;
    value W1_K4_groups
    low-1='Receive equal treatment'
    7='Do not receive equal treatment'
    9-high='Not sure';

/* formatting for PPAGECT4 - Age */
PROC FORMAT;
    value PPAGECT4_groups
    1='18-29'
    2='30-44'
    3='45-59'
    4='60+';

PROC PRINT; VAR W1_K1_C PPEDUCAT W1_K4 W1_M1 PPAGECT4;

PROC FREQ; TABLES W1_K1_C PPEDUCAT W1_K4 PPAGECT4;
    Format W1_K1_C W1_K1_C_groups.;
    Format PPEDUCAT PPEDUCAT_groups.;
    Format W1_K4 W1_K4_groups.;
    Format PPAGECT4 PPAGECT4_groups.;

/* Vertical Bar Charts Categorical Variables */
PROC GCHART; VBAR W1_K1_C/Discrete type=PCT width=5; /*Categorical variable Trust*/

PROC GCHART; VBAR W1_K4/Discrete type=PCT width=5; /*Categorical variable Treatment*/

PROC GCHART; VBAR PPEDUCAT/Discrete type=PCT width=5; /*Categorical variable Education*/

/* Vertical Bar Charts Quantitative Variables */
PROC GCHART; VBAR PPAGE/Discrete type=PCT; /*Age*/

/* Univariate analysis - should be quantitative variables*/

PROC UNIVARIATE; VAR PPAGE;

PROC GCHART; VBAR PPAGECT4/Discrete type=mean SUMVAR=W1_K4;

PROC GCHART; VBAR PPEDUCATgroup/Discrete type=mean SUMVAR=W1_K4;

RUN;