Data Analysis and Interpretation: Pearson Correlation
I am using the ‘Outlook on Life’ survey data to investigate if age or education play a role in whether people think blacks and other minorities are treated the same as whites in the criminal justice system (W1_K4 in the codebook) or in whether they have trust in the legal system (W1_K1_C in the codebook). Both of these categorical response variables have multiple levels, as do the explanatory variables. Since the Pearson correlation is a measure of the linear correlation between two X and Y quantitative variables I am going to complete this assignment using the GapMinder data instead.
For this exercise, I will examine the relationship between a country’s wealth and life expectancy. In the GapMinder data, the wealth of a country can be measured with GDP per capita (variable: incomeperperson) and life expectancy by years with a variable of the same name (variable: lifeexpectancy).
Using a scatter plot to visualize the data is the first step. The graph below indicates a positive relationship between GDP per capita and life expectancy. The relationship appears to follow a curvilinear (non-linear) pattern so a large correlation coefficient, r, is not expected as the Pearson correlation coefficient is meant to measure linear relationships.
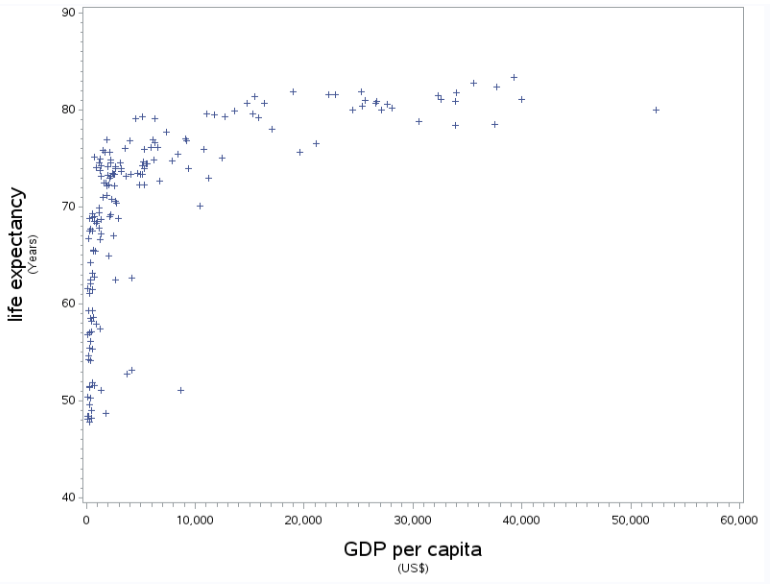
SAS Output: Scatter Plot - GDP per capita v Life Expectancy, Source: S. Prestridge
Reviewing the output tables shows the Pearson correlation coefficient, r, is equal to 0.60 (moderate strength) with a p-value less than 0.0001 so the correlation also holds for the population. r-squared is equal to 0.36 which means that 36% of the variability in life expectancy can be explained by the variation in GDP per capita.
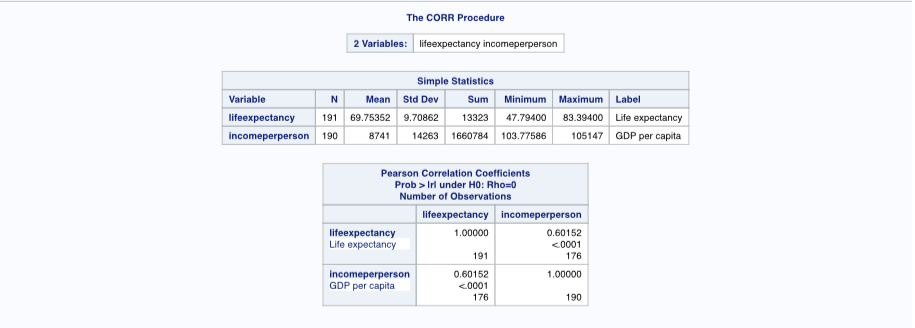
SAS Output: Pearson correlation coefficient tables - GDP per capita v Life Expectancy, Source: S. Prestridge
Full results available as a PDF
SAS Program Code
Full code of the SAS program is shown below.
LIBNAME mydata "/courses/d1406ae5ba27fe300" access=readonly;
DATA new; set mydata.gapminder;
label incomeperperson="GDP per capita"
    lifeexpectancy="Life expectancy";
proc sort; by country;
proc gplot;
axis1 label=(f="verdana" h=1.9 "GDP per capita" justify=c f="verdana" h=1.2 "US$")
order=(0 to 60000 by 10000)
value=(f="verdana" h=1.2 "0" "10,000" "20,000" "30,000" "40,000" "50,000" "60000");
axis2 label=(a=90 f="verdana" h=1.9 "life expectancy" justify=c a=90 f="verdana" h=1.2 "Years");
plot lifeexpectancy*incomeperperson/haxis=axis1 vaxis=axis2;
proc corr; var lifeexpectancy incomeperperson;
run;
Bonus material - Outlook on Life analysis
Just to see what the results would be I examined Pearson correlation coefficients for several of the Outlook on Life variables. The first two were the original questions I was interested in.
-
W1_K4: “Are blacks & other minorities treated the same as whites in the criminal justice system?” -
W1_K1_C: “Do You trust the legal system?” -
W1_M5: “Attendance of religious services” -
W1_P9: “Has anyone in your household been arrested” -
W1_P20: “Personal Income” -
W1_N1d: “Rate White people” -
W2_J1_B: “Rate people in jail”
See the results table below.
General findings are that although there are several variables with p-values less than 0.0001, indicating statistical significance for the population, there are few strongly correlated variables as indicated by r - the Pearson correlation coefficient. The largest r-value of 0.45 for personal income and education indicates a moderate strength relationship and yields an r-squared of 0.20 which means only 20% of the variability in personal income can be explained by the variation in education. Regarding the original two questions - belief that blacks and minorities are treated the same as whites in the criminal justice system and general trust in the legal system, neither appears to be strongly correlated with age, education, income, living with someone convicted of a crime, feelings toward white people or people in jail, or attendance of religious services.
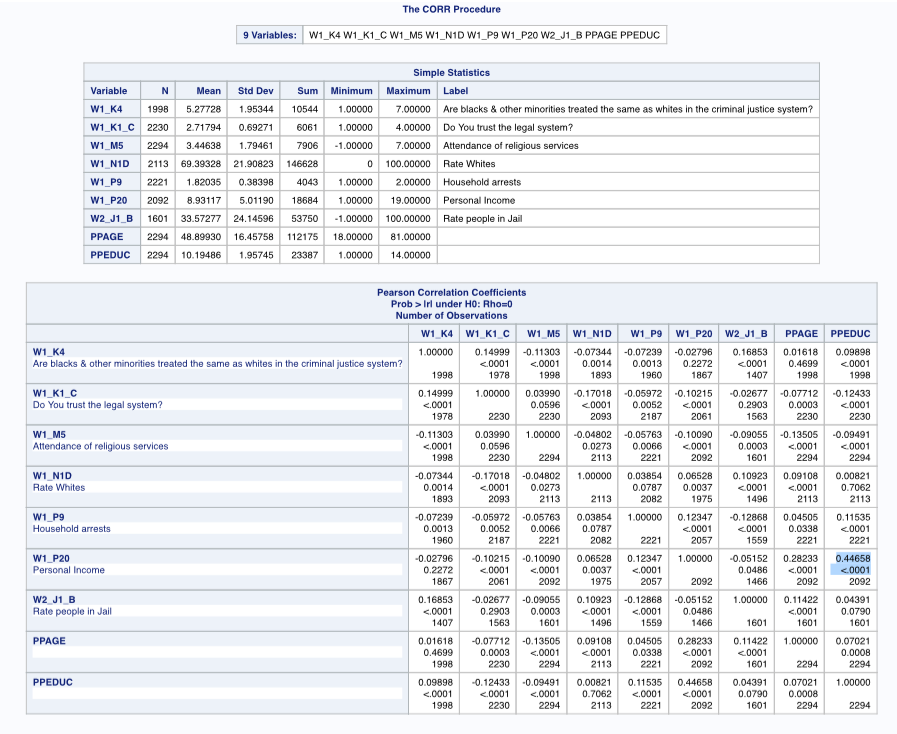
SAS Output: Pearson correlation coefficient tables - Outlook on Life, Source: S. Prestridge