Data Analysis and Interpretation: Writing about data
Learning continues with a third module, ‘Regression Modeling in Practice’. This week’s assignment is to demonstrate the ability to write about data using a specific framework. As a data analyst, an important skill to master is the ability to describe data so others are able to understand the population the sample came from, the procedures used to collect the data, and the measures used in the statistical analyses. This background information is critical for understanding who or what is being analyzed and how. It also helps to understand the limitation of the analysis. My assignment for this week follows.
I am utilizing the Outlook on Life Surveys, 2012 published by the Inter-university Consortium for Political and Social Research (ICPSR).
The survey considered the ways in which social class, ethnicity, marital status, feminism, religiosity, political orientation, sexual behavior, and cultural beliefs or stereotypes influence opinion and behavior. Participants were asked an array of questions pertaining to voting preference, party identification, respondent perception of opportunity for success, and views on interracial dating. These variables and questions examine political and social attitudes in the United States. Additional questions addressed issues such as common fate, nationalism, equality, discrimination, and relations with law enforcement.
Demographic variables include race ethnicity, age, gender, religious involvement, sexual orientation, citizenship, annual income, and education.
Sample
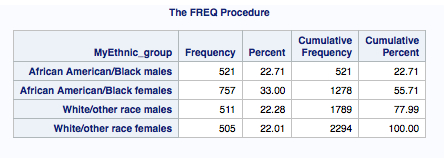
The sample of 2,294 respondents was drawn from two surveys fielded between August and December 2012 using a sample from an Internet panel. The ethnic composition of the target population was comprised of four groups, all aged 18 and older:
- African American/Black males (n=521, 22.7%),
- African American/Black females (n=757, 33%),
- White/other race males (n=511, 22.3%),
- White/other race females (n=505, 22%).
All respondents were non-institutionalized and residing in the United States. Participants were drawn from the GfK Knowledge Network, a web panel designed to be representative of the U.S. population. The unit of observation was the individual. The time method was cross-sectional ad-hoc follow-up as 1,601 respondents were interviewed as part of Wave 2 follow-up.
Procedure
Panel members were randomly recruited through probability-based sampling, and households were provided with access to the Internet and hardware when needed. Random-digit dialing and address-based sampling methodologies were utilized. Individuals responded to the web-based survey with a 55.3 percent response rate for Wave 1 and a 75.1 percent response rate for Wave 2.
Measures
The measure of trust in the legal system was drawn from the responses to a question about how much the participants felt they could trust various institutions (W1_K1_C). The question is categorical and divides responses into four categories:
- Just about always
- Most of the time
- Only some of the time
- Never
The measure of whether participants believe that blacks and other minorities are treated the same as whites in the criminal justice system was drawn from responses to that question (W1_K4 in the survey). The question is categorical and divides responses into a seven point scale from ‘1 - Receive equal treatment’ to ‘7 - Do not receive equal treatment’.
Other standard measures used included age, income, race / ethnicity, and education.